I’d previously inherited a legacy SQL environment running SSAS with a handful of multi-dimensional models. The models were actively being used however development on them had ceased a number of years earlier so it was just a case of keeping the lights on.
The problem
Fast forward to the point we wanted to start winding down and migrating teams away from the platform and we wanted to have a peek at who was doing what in those cubes. Fortunately the team who set up the environment previously had enabled query logging into a database table which we could interrogate the activity in the environment. Or so we thought.
Upon checking we found the logs had stopped a while back and we didn’t have anything to review. There weren’t any entries in the SQL logs, no details in the event viewer to find, none of our alerting had been triggered – it had just stopped.
Finding a solution
Looking into this issue it turned out to be quite a niche scenario however I stumbled upon an old post from Mike Diehl back in 2013 where he addressed the same challenge and his solution worked a treat for us. I thought it was worth recapping this due to the age of the post and the images being broken on the old post.
Essentially the issue boils down to the fact that if there are any issues contacting with the database – whether that be a communication failure, authentication, storage, etc. – then the logging will cease. There’s no retry or resume mechanism within the logging engine so we need to kick it back into life.
In my experience a restart of the server itself won’t necessarily resolve this as we’ve also had outages with the logs caused by patching windows. My assumption with this is that the Analysis Services engine is online sooner than the database engine and so it’s unable to establish a connection and fails.
Potentially a restart of the Analysis Services service may kick this back in, however in a production environment the windows for that may be small depending on availability expectations.
The solution which Mike puts forward is available whilst the system is online and requires no downtime – we refresh the connection to the database.
Walkthrough
We’re going to be changing a property of the database connection which will recreate it. The property we’re changing however won’t change anything functionally with the connection so it’ll effectively just refresh it.
To start with we need to connect to our Analysis Services instance in Management Studio and once connected right click and select the Properties on the server – the root node within the tree structure.
This will pop open a new window with a list of properties which we can review. The specific one we’re looking for relates to the connection string for the query log:

More details about configuring the query log can be found in the online documentation.
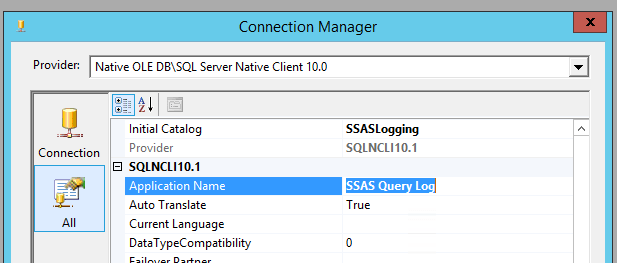
When we find this entry we can select the field under the Value column a small button will appear there to allow us to configure that connection. Within the dialog which pops up we’re now looking for the Application Name property which you can finder under the provider node:

This property is just a label to tell SQL Server which application is connecting. It won’t change how the connection behaves, it’ll just show this if someone were to query active queries or connections such as with sp_WhoIsActive or sp_BlitzWho for example.
All that’s left for us to do is change this property and confirm the settings change. Once that’s done the connection will be re-established and the logging will then resume as expected.
Wrap up
Here we’ve looked at being able to restart the query logging on our Analysis Services instance whilst maintaining availability of the service. This may be an obscure issue to encounter however it can be a frustrating time given the lack of visibility that the connection has dropped.
Thankfully Mike had shared just the right post to resolve the situation in a simple, clean and very effective method. Hopefully this reiteration can help someone in a similar position as I was.