
I recently ran into an issue when trying to call a function from an ADF pipeline. The function returned a generic Internal Server Error with no details exposed. Here we’ll look at how to dig into the logs to identify the true cause of the failure.
In this instance the function was performing PGP encryption but this could apply to any function. Let’s start with the problem.
Failures
When the function was called in a pipeline it was failing and presenting with a very generic Internal Server Error with no meaningful details:


That’s not too helpful. Do we see anything better if we test the function directly through the Azure portal?

Nope, plus the App Insight logs from the same screen aren’t any use either:
2024-06-25T10:07:45Z [Information] Executing ‘EncryptOnDemand’ (Reason=’This function was programmatically called via the host APIs.’, Id=caa8467e-abb7-41ff-872c-9212859770a4)
2024-06-25T10:07:45Z [Error] Executed ‘EncryptOnDemand’ (Failed, Id=caa8467e-abb7-41ff-872c-9212859770a4, Duration=1ms)
This doesn’t provide any indication if there’s an error with the Function, the parameters, the environment setup, configuration, etc.
We need to dive into the logging for the function to find more details.
Digging in
The solution for this was to use the Kudu service to view the logs. I haven’t needed to use this previously but it turns out this sits behind the function (more details here) and has a wealth of information.
You can access this through the Azure portal for your function under Development Tools > Advanced Tools.
Specifically we’re after the Debug Console which the service provides. This is available via the navigation or directly by replacing your function name in the URL below:
https://func-name.scm.azurewebsites.net/DebugConsole
Within the Debug Console we have command line / Powershell available to us, but we also have the local file system used by the service too. We can navigate the folders to find the logs for each method in our Function app under:
LogFiles > Application > Functions > Function
This will have a directory for each method that contains the generated logs which appear to roll over daily:

Depending on the size of the logs you can either download them or view (edit) directly in the browser to see what the details. Here’s a snip of the view for a log file containing one execution:
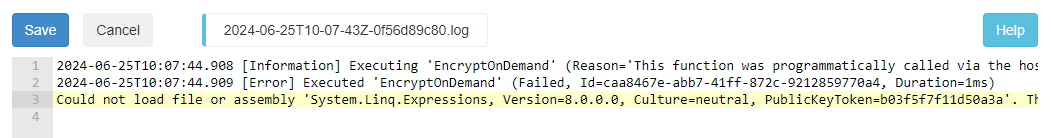
You’ll see in here we have the same details reported by App Insights in the portal but critically we have the real error message which has been eluding us this whole time – a missing assembly!
Now we can get on with resolving the actual issue. Once fixed we can get back to running happily in Data Factory:

That’s all there is to it. Short and sweet this week, time to enjoy the good weather.

One reply on “Debugging Failed Function Calls in Data Factory”
[…] Andy Brownsword troubleshoots a problem: […]