Rounding out T-SQL Tuesday for 2024, Kevin’s invitation brings it together with the Festive Tech Calendar (more on that at the end), and asks us to write about a Microsoft Data Platform announcement that could be considered a gift.
For context, this post is targeted at developers or engineers who don’t have the time to dig into SQL Server but want to extract more performance from their applications or processes. For me there’s a standout feature for just this situation…
Query Store is cheating
Reviewing performance for a SQL database over time can be a challenge without hand crafted tooling or using external monitoring apps. This isn’t about putting fires out, we’re looking at proactive monitoring and taking action for incremental improvements.
The Query Store comes to the rescue by providing built-in insights into key performance metrics over time. We can use different combinations of them to better understand how the database is working.
In this post we’re going to briefly dive into the Query Store to see what it can do, and also what you can do to help with the results you see.
Let’s jump straight in.
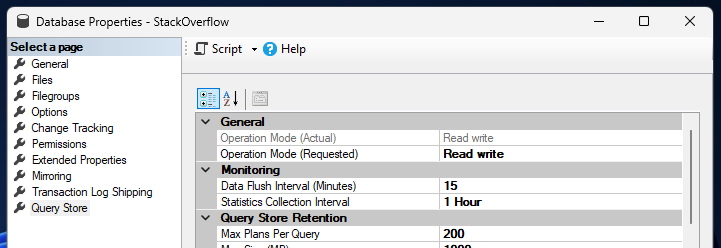
First up, enabling the Query Store. If you’re using SQL Server 2022, Azure SQL Database, or Managed Instance, this will be enabled by default. On older versions, or to enable it manually, we’ll need to jump into the database properties below.
Changing the Operation Mode setting to ‘Read write’ will enable it, and I’ll leave the other settings as their defaults here:
Once the Query Store is enabled, it’ll start to gather its metrics for the queries being executed. This will include direct queries as well as stored procedures so it should capture your workloads in most instances.
Let it have settle in.
You’ll want to give it some time to get a view of the workload. For this demonstrations below I’ve burned a couple of hours of CPU to get us started.
Like a kid in a Query Store
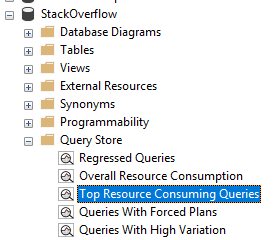
Now we can get to the juicy details inside the Query Store. This has its own reports built in, which are inside the database.
A good place to start is with the ‘Top Resource Consuming Queries’ report:
We’ll take a quick look around the report view:
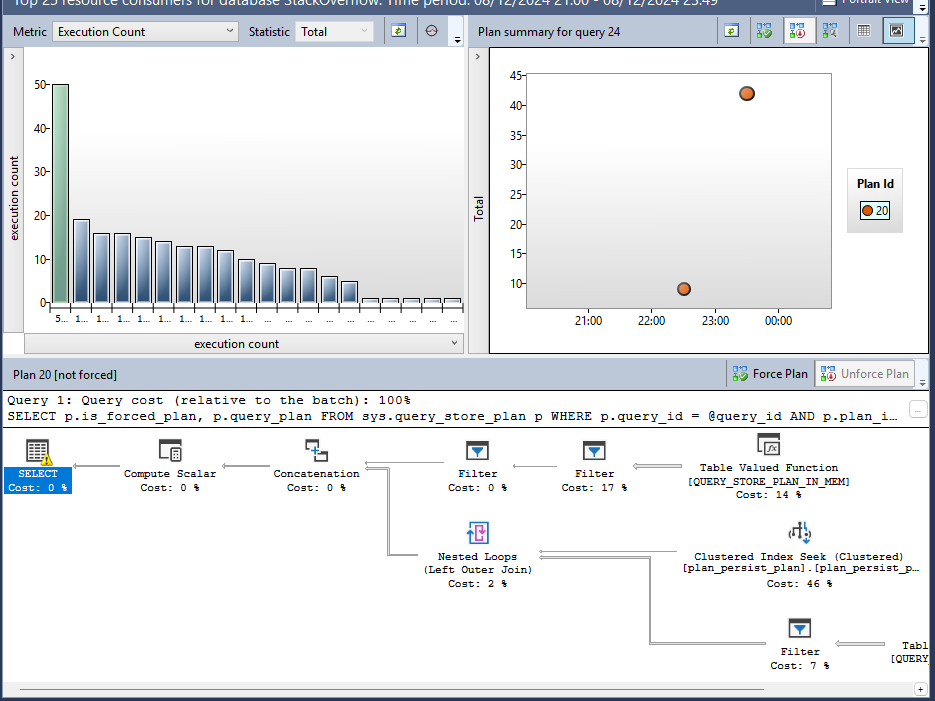
- Top left pane: this shows the top results prioritised based on the metrics being applied. Each bar is a different query. The metrics can be changed above the pane to try different combinations
- Top right pane: shows how the selected query (from the top left) performed over the specified period. You may also see different coloured data points which indicate different plans being used for the same query
- Lower half: this is the execution plan for the selected query. If you’re used to those, great. If not, then generally speaking, the fatter lines show where there’s a lot of data moving around and the ‘costs’ show an estimate of where the work is involved
By default the report will show us the last hour of metrics, but we’re here for proactive work, not reactive. There’s a Configure button to the top right of the report where you can set the time period if you wanted to look at the last day or week for example.
Now that we understand what we’re looking at, let’s review a a couple of the metric combinations you can take action on:
Total execution count
By reviewing the total number of executions for a statement or procedure, we can identify the chattiest part of the database. Queries share the CPU, so more queries running means a smaller slice of CPU time each.
By using the total metric we can see which are the queries being ran most often which could impact others on the system if we have a very skewed distribution.
Below are a few ways we can look at tackling queries which are being executed very frequently:
- Review the application to understand why the query runs so frequent and if that’s needed. For example rather than querying a product individually, retrieve them all at once and process individually on the app side
- If there are repeated identical calls, a cache within the application or an intermediary later can both improve responses to the application, and avoid any additional load on the database completely
- Perform specific database changes – such as adding indexes – for extremely frequent queries if they’re a large portion of the workload. Helping them run as fast as possible will minimise the time they take up on the CPU
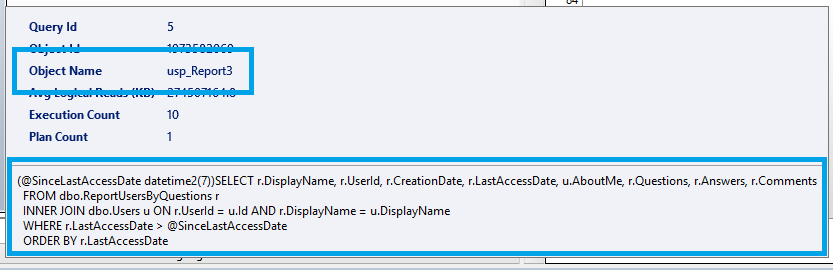
This is also a great time to highlight the tooltip which is available in this pane. This crucially shows the text for the query being executed, and the store procedure its contained within (the Object Name) if relevant:
Average logical reads
Some queries will have upward or downward spikes when searching for more obscure data. They can be more trouble to deal with. Looking at averages helps pinpoint queries which are consistently slower and are lower hanging fruit for improvements.
Logical reads are where the query needs data from somewhere – regardless if that is disk or memory. More reads means more to search through, and therefore slower queries. Again we’d expect to see a somewhat skewed distribution for our key offenders:
With a prioritised list of these queries we’d want to take action to reduce the amount of data needing to be read. The typical way to do this is through the addition of an index.
Clearly each query will be doing something different and need tackling differently. Below are some pointers to help guide you through the query plan and options to consider:
- Look for the tables with much higher costs from the plan, or with very thick lines, These are likely your primary contenders for an index
- Review how these tables are being used, potentially with a view to apply an index to help search them faster
- Look out for non-SARGable queries which might cause more data to be read than needed. Take a look at this post from Brent for some pointers
- Also review any index recommendations which are shown on the query plan (green text above the plan, if present) as these may guide you towards problem tables. Also check out this post from Steve before blindly applying those suggestions
Using the Average statistics for the CPU metric is a similar story. It will be the amount of work being done on the data. If we can reduce the amount of data needed above, then this can naturally reduce the CPU to process that data at the same time.
Changes over time
Once we’ve identified and taken action on the queries we can use the same approach to continue monitoring. Initially we can ensure that the queries aren’t performing worse, and then over time we can review the performance improving.
When we’ve made changes – particularly if we’ve added an index for example – we might notice a difference in how the historical trend is displayed. It can have multiple colours present. These represent different approaches the server has taken to process the query.
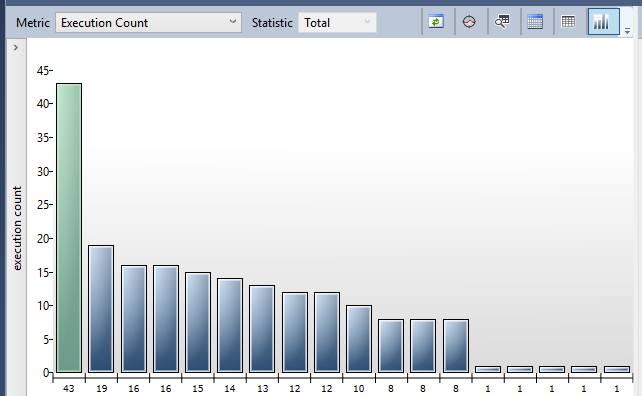
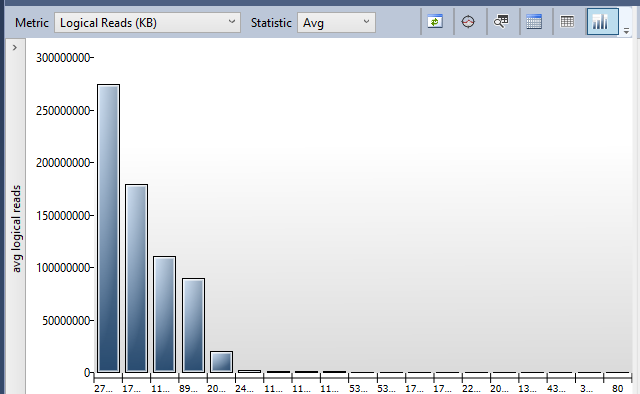
For example here’s the impact of adding an index to one of my sample workload, showing the average reads:

We can see the original query had a high volume of reads. The introduction of an index changed the way that the server approached the query (this is called the ‘plan’).
The original query had a high volume of reads. The introduction of an index changed the way that the server approached the query (a different plan). The result of this was a huge reduction in the amount of data needing to be read.
It’s the same query, but much better.
You can use the legend of the different plans to switch the lower pane and see the differences in how the work is being done across the data. With index changes you’d also expect to see slimmer lines due to less data needing to be handled.
Wrapping up
In this post we’ve had a quick look at how Query Store can help us with regular proactive performance improvements to our SQL Server databases, all right out of the box.
As a developer, the Query Store can provide a friendly way to dive into the database performance without being overwhelmed by scripts or other tooling. It also presents the information visually to make it easier to consume, faster understand act on, and clearer to demonstrate changes over time.
We’ve also looked at two particular metric options and a few options for how we might tackle particularly troublesome offenders for those metrics.
For a more in-depth introduction to Query Store check out this article from Microsoft.
Before you go
I hadn’t come across the Festive Tech Calendar prior to this invitation. There are some interesting topics I’ll be taking a look at from this year’s offerings. They’re all available for free from the link above or this YouTube playlist.
The calendar also raises money each year for a charity. This year they’ve selected Beatson Cancer Charity in Scotland. In the UK someone is diagnosed with cancer every two minutes, and unfortunately it will likely impact us or someone we know at some point through our lives.
If you enjoy the content which the calendar has provided and would like to support the charity, you can do so via the calendar’s JustGiving page.

6 replies on “T-SQL Tuesday #181 – The Festive Tech Calendar ft. Query Store”
[…] Andy Brownsword gets into the spirit: […]
[…] Andy Brownsword also covers Query Store and goes into great detail about it in his post that covers the Festive Tech Calendar ft. Query Store. […]
[…] simple way to find these is with the Query Store. Use the Execution Count metric to help identify […]
[…] running queries, reviewing execution plans, or diving into Query Store it’s not uncommon to see missing index recommendations, particularly for more complex […]
[…] contention is wider across the environment you’ll want specific tools to help out. Query store is a game changer for quickly finding performance outliers to tackle. There are 3rd party solutions such as […]
[…] T-SQL Tuesday #181 – The Festive Tech Calendar ft. Query Store (Wrap-up) […]