
We revisited window functions last week for T-SQL Tuesday. As we’re in that area there’s another example I thought was worth exploring. Can we group data whilst applying window functions in the same query?
The problem
For our example we’ll use the same sample data as last week. This contains sales values broken down by period, also containing quarter and year:
CREATE TABLE #MonthlySales (
    FinancialYear CHAR(6),
    FinancialQuarter CHAR(7),
    FinancialPeriod CHAR(7),
    SalesValue MONEY
);

INSERT INTO #MonthlySales
VALUES ('FY2021', '2021Q01', '2021P01', 1700.99), ('FY2021', '2021Q01', '2021P02', 2.29), ('FY2021', '2021Q01', '2021P03', 9.99), ('FY2021', '2021Q02', '2021P04', 1214.85), ('FY2021', '2021Q02', '2021P05', 2049.10), ('FY2021', '2021Q02', '2021P06', 3.99),
    ('FY2021', '2021Q03', '2021P07', 54.99), ('FY2021', '2021Q03', '2021P08', 24.49), ('FY2021', '2021Q03', '2021P09', 2181.56), ('FY2021', '2021Q04', '2021P10', 564.99), ('FY2021', '2021Q04', '2021P11', 699.09), ('FY2021', '2021Q04', '2021P12', 53.99),
    ('FY2022', '2022Q01', '2022P01', 29.99), ('FY2022', '2022Q01', '2022P02', 7.95), ('FY2022', '2022Q01', '2022P03', 21.49), ('FY2022', '2022Q02', '2022P04', 769.49), ('FY2022', '2022Q02', '2022P05', 21.98), ('FY2022', '2022Q02', '2022P06', 539.99),
    ('FY2022', '2022Q03', '2022P07', 3399.99), ('FY2022', '2022Q03', '2022P08', 32.60), ('FY2022', '2022Q03', '2022P09', 49.99), ('FY2022', '2022Q04', '2022P10', 1000.43), ('FY2022', '2022Q04', '2022P11', 742.35), ('FY2022', '2022Q04', '2022P12', 4.99);
In last week’s post we saw how we could look at relative averages. This example shows sales for the period versus the quarter:
SELECT
	FinancialPeriod,
	SalesValue,
	QuarterAvg = AVG(SalesValue)
		OVER (PARTITION BY FinancialQuarter)
FROM
	#MonthlySales;
However this example doesn’t perform any aggregation outside of the window function. Can we do the same if we grouped by period versus the average for the year?
This is how we might expect it to look:
SELECT
	FinancialQuarter,
	QuarterAvg = AVG(SalesValue),
	YearAvg = AVG(SalesValue) OVER (PARTITION BY FinancialYear)
FROM
	#MonthlySales
GROUP BY
	FinancialQuarter;
However this throws up an error when trying to execute:
Column ‘#MonthlySales.FinancialYear’ is invalid in the select list because it is not contained in either an aggregate function or the GROUP BY clause.
Ok that’s fine, a quarter is a subset of a year so we can include that right?
SELECT
	FinancialQuarter,
	QuarterAvg = AVG(SalesValue),
	YearAvg = AVG(SalesValue) OVER (PARTITION BY FinancialYear)
FROM
	#MonthlySales
GROUP BY
	FinancialYear,
	FinancialQuarter;
…but we still have an issue:
Column ‘#MonthlySales.SalesValue’ is invalid in the select list because it is not contained in either an aggregate function or the GROUP BY clause.
So why are we being asked to group by the values we’re using in the window function?
The issue
Window functions are applied to the set of results from the query. This means that they’re calculated after grouping has taken place. This impacts two areas of our function:
- The field being partitioned must be grouped by. This is that we know our results could be split by that value when performing the function
- The aggregated field for the window function must be valid for the initial results. They either need to be grouped or aggregated before applying the window function
They field being partitioned is logical. If we can’t segregate our results by that field then we can’t window the data to apply our function correctly. This is why it was correct to add the Financial Year into our GROUP BY clause above.
What about our Sales Value, how do we handle that?
Double tap
Our Sales Value is a measure which we want to aggregate so grouping isn’t appropriate. So we’re supposed to aggregate an aggregate? Yep.
For anyone familiar with Zombieland you’ll remember Rule #2: Double Tap.

That’s exactly what we’ll be doing in this situation. We’ll be applying two aggregates in our window function definition.
When dealing with a SUM we can apply those twice as totalling totals will be fine. Averages of averages however don’t work quite the same. In this instance we know that each Year has 4 Quarters, which each have 3 Periods. Due to the equal distribution we could apply the AVG function twice.

So, we could apply the AVG function to our data twice. And it works. In this instance. We can do better than that though.
A better fix
Let’s mix it up. How about if we had 4 week periods. This would mean we have 13 periods per year. What can we do then?
INSERT INTO #MonthlySales
VALUES ('FY2021', '2021Q04', '2021P13', 123.45),
	('FY2022', '2022Q04', '2022P13', 678.90);
Now we’ve got uneven data and our previous solution doesn’t work well:

Now we really do need a better solution.
As we want to apply two functions we need to visualise how they are being rendered. Let’s look at the AVG AVG scenario:

We’ve taken our grouping and our inner average function to see those results. The averages are correct for the Quarter, but we have no indication of Quarter 4 containing 5 periods and being weighted more. We need another way to calculate this grouped average.
What is an average? A total of the values divided by the number of values. Sounds like a SUM and COUNT function. Let’s visualise those:

These are the values which we need to correctly calculate our averages. If we total the Sum for each Quarter and then divide by the total Count we’ll have our average.
Our solution for this average is:
SELECT
	FinancialQuarter,
	QuarterAvg = AVG(SalesValue),
	YearAvg = SUM(SUM(SalesValue)) OVER (PARTITION BY FinancialYear) /
		SUM(COUNT(1)) OVER (PARTITION BY FinancialYear)
FROM
	#MonthlySales
GROUP BY
	FinancialYear,
	FinancialQuarter;

We’ve needed to use two window functions as we need to perform the SUM and COUNT separately before applying our window function onto those results.
The wrong way
I think it’s useful to demonstrate how not to do this.
We can’t wrap the whole calculation into a single window function. We may think that we could do something like:
SELECT
	FinancialQuarter,
	QuarterAvg = AVG(SalesValue),
	YearAvg = SUM(SUM(SalesValue) / COUNT(1)) OVER (PARTITION BY FinancialYear)
FROM
	#MonthlySales
GROUP BY
	FinancialYear,
	FinancialQuarter;
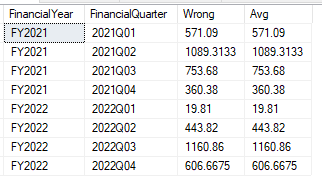
The issue with this goes back to how our window functions are applied after the initial results. To see the issue we can visualise the intermediary result before the window function is applied. We’ll see that this would actually be calculating an average which would then be totalled:
SELECT
	FinancialYear,			/* Partition by */
	FinancialQuarter,		/* Group by */
	Wrong = SUM(SalesValue) / COUNT(1),
	[Avg] = AVG(SalesValue)
FROM
	#MonthlySales
GROUP BY
	FinancialYear,
	FinancialQuarter;
Wrap up
Today we’ve looked at applying window functions to queries where we are already grouping and aggregating data.
This makes applying the window function more complex. To help with this we’ve shown how to visualise the initial grouping and aggregation to understand what the window function will be applied against.
We’ve worked through an example showing how to achieve the right result (and the wrong one).
I hope this has helped cement the nuances with applying multiple layers of grouping. It’s not a situation I’ve come across many times, it would be great to hear tips from any other folks who’ve stumbled across the challenges with these.

4 replies on “Mixing Grouping and Window Functions”
[…] Andy Brownsword aggregates some data: […]
[…] After last week’s post I got to thinking that although we’ve looked at how to implement window functions, we haven’t peeked under the hood to see how they are executed. […]
[…] Mixing Grouping and Window Functions […]
[…] they’re very powerful. We’ve previously looked at aggregate window function, grouping with them, optimising them and the WINDOW clause if you want to know more about […]