
I’ve recently been reviewing SSIS packages to make some performance fixes and needed a way to validate the results of those changes. I thought I’d share the scripts as they may be useful for others.
Rather than relying on run times from the SQL Agent running the packages I wanted to dive deeper into the packages so took another approach.
The Integration Services catalog (SSISDB, introduced back in SQL Server 2012) is used for the metadata we need. This contains some tables with enough details to get some reasonable performance metrics. The ones I’ll be referencing in particular:
- internal.executions – a record for each time a package is executed including its folder, name, environment used. This doesn’t contain run time details
- internal.operations – a sort of audit of actions in SSIS including deployments, but also package executions. This includes run time details
- internal.executable_statistics – details for each element of a control flow which is executed as part of a package. For loops you will see multiple entries based on the number of iterations. This includes run time details for the specific component
The metrics used here are based on those tables and using the default (Basic) logging level within SSIS. Other levels may contain more or less granular details depending on which you choose.
The first of these scripts is used to view overall run time for a package. At a high level we can see how the latest runs compare to the average run times:
SELECT e.execution_id,
	o.start_time,
	o.end_time,
	RuntimeMin = DATEDIFF(SECOND, o.start_time, o.end_time) / 60.0,
	AvgRuntime = AVG(DATEDIFF(SECOND, o.start_time, o.end_time) / 60.0) OVER (),
	Scale = CAST((DATEDIFF(SECOND, o.start_time, o.end_time) / 60.0)
	    / (AVG(DATEDIFF(SECOND, o.start_time, o.end_time) / 60.0) OVER ()) AS DECIMAL(9, 2)),
	[Status] = CASE o.status WHEN 1 THEN 'Created' WHEN 2 THEN 'Running' WHEN 3 THEN 'Cancelled'
		WHEN 4 THEN 'Failed' WHEN 5 THEN 'Pending' WHEN 6 THEN 'Ended Unexpectedly'
		WHEN 7 THEN 'Succeeded' WHEN 8 THEN 'Stopping' WHEN 9 THEN 'Completed' ELSE 'Unknown' END
FROM internal.executions e
	INNER JOIN internal.operations o ON e.execution_id = o.operation_id
WHERE e.package_name = @'PackageName.dtsx'
ORDER BY e.execution_id DESC;
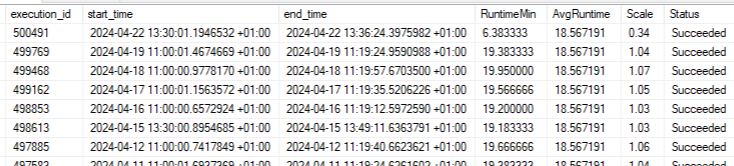
This shows various run time metrics but the most important from my perspective is the Scale column. A value of 1 indicates it ran in the average time, anything over indicates longer than usual, and less than 1 shows an improvement.
Previous run times were very consistent and once the performance change was made we managed to drop this by 65%.
We can also drill further into the packages. We mentioned the executable_statistics table above which goes down to the control flow level.
A more granular view can be helpful to understand if benefits are seen from specific changes. I’ve had instances previously where one component has benefited from a change and another has not so the overall run time stayed the same.
We’ll take a similar approach with those details to compare against previous runs:
DECLARE @PackageName NVARCHAR(520) = 'PackageName.dtsx',
	@LastExecutionID BIGINT;

SELECT TOP (1) @LastExecutionID = e.execution_id
FROM internal.executions e
WHERE e.package_name = @PackageName
ORDER BY e.execution_id DESC;

WITH AvgDurations AS (

	SELECT s.execution_path, AvgDuration = CAST(AVG(s.execution_duration) AS FLOAT)
	FROM internal.executions x
		INNER JOIN internal.executable_statistics s ON x.execution_id = s.execution_id
	WHERE x.package_name = @PackageName
	GROUP BY s.execution_path
)
SELECT s.execution_path,
    s.start_time,
    s.end_time,
    s.execution_duration,
    ad.AvgDuration,
    Scale = ROUND(s.execution_duration / ad.AvgDuration, 2)
FROM internal.executable_statistics s
	INNER JOIN Avgdurations ad ON s.execution_path = ad.execution_path
WHERE s.execution_id = @LastExecutionID
ORDER BY s.statistics_id;

(The last record will be the total runtime for the whole process)
This time the data is presented only for the latest execution, as there may be quite a lot of components involved. It wouldn’t make sense to see all historical details. Instead we have one record per component, and alongside is the execution time for the latest execution next to the average duration for all recorded executions.
The Scale field is again included here to gauge potential anomalies in performance. It needs to be taken in the context of the component and typical run time. For example the ‘Send Mail Task’ towards the end is showing fast performance compared to average, however it’s a very small part of the whole process and not likely something we can tune.
Where this package was tuned however was the ‘Execute SQL Task’s on the rows 4 and 5. The procedures were tuned and we can see dramatic decreases in their durations, showing 91% and 98% respectively.
Wrap up
In this post we’ve looked at a couple of SQL queries which can be ran against the SSIS database to help analyse execution performance for a package. These were helpful in ensuring benefits were seen from some tuning work.
The queries focus on latest execution compared to a historical average. The benefit of this is for recent changes as the improvement would carry more weight to the average as time passed.
Whilst I haven’t used them here, you can get the folder, project, and package names as well as the package from the executions table. There are also other tables which may be relevant within the database for different types of analysis.
These could be extended to look for bottlenecks or anomalies across multiple packages for example. I’ll be looking to tackle this soon myself so I’ll be sure to share any other scripts which may be beneficial.

One reply on “Reviewing SSIS Performance Using the Catalog”
[…] Andy Brownsword digs into SSISDB: […]