
Performance issues in SSIS packages can be tough to track down. You know something is off but trawling through pages of SSIS reporting and the validation noise is frustrating. Adding your own logging is a nice idea but not feasible at scale.
An alternative?
Querying internal tables within the SSIS database is a quicker way to take its metrics and turn it into something more meaningful and actionable.
Here’s a script I use as a starting point. It’s based on the details recorded under the Basic logging level we looked at last week and provides a helpful summary:
USE SSISDB

/* Change package name as required */
DECLARE @PackageName NVARCHAR(520) = 'Package.dtsx',
    @ExecutionId BIGINT;

/* Select which execution, customise as needed */
SELECT TOP (1) @ExecutionId = e.execution_id
FROM internal.executions e
WHERE e.package_name = @PackageName
ORDER BY e.execution_id DESC;

/* Return the summary */
SELECT ExecutionId = es.execution_id,
    TaskPath = es.execution_path,
    StartDateTime = CAST(es.start_time AS DATETIME2(0)),
    EndDateTime = CAST(es.end_time AS DATETIME2(0)),
    RunTimeSeconds = es.execution_duration / 1000,
    [%Total] = CAST(100 * es.execution_duration / SUM(CAST(es.execution_duration AS FLOAT)) OVER () AS DECIMAL(5,2)),
    Indicator = REPLICATE('+', es.execution_duration / (SUM(CAST(es.execution_duration AS FLOAT)) OVER () * 0.05)),
    w.Warnings,
    rw.RowsWritten
FROM internal.executable_statistics es
    INNER JOIN internal.executables e ON es.executable_id = e.executable_id
    OUTER APPLY (
        SELECT Warnings = CASE WHEN COUNT(1) = 0 THEN 'No warnings'
            ELSE CONCAT(CAST(COUNT(1) AS VARCHAR), ' warnings across ', CAST(COUNT(DISTINCT(em.subcomponent_name)) AS VARCHAR), ' subcomponents')
            END
        FROM internal.event_messages em
            INNER JOIN internal.operation_messages om
                ON em.event_message_id = om.operation_message_id
        WHERE em.operation_id = es.execution_id
            AND em.execution_path = es.execution_path
            AND om.message_type = 110
        ) w
    OUTER APPLY (
        SELECT RowsWritten = SUM(CAST(SUBSTRING([message], CHARINDEX('wrote', [message]) + 6, CHARINDEX('rows.', [message], CHARINDEX('wrote', [message])) - (CHARINDEX('wrote', [message]) + 6)) AS INT))
        FROM internal.event_messages em
            INNER JOIN internal.operation_messages om ON em.event_message_id = om.operation_message_id
        WHERE em.operation_id = es.execution_id
            AND em.execution_path = es.execution_path
            AND om.[message] LIKE '% wrote % rows%'
        GROUP BY em.operation_id, em.execution_path
        ) rw
WHERE es.execution_id = @ExecutionId
    AND NOT EXISTS (        /* Ignore root / containers */
        SELECT 'exists'
        FROM internal.executable_statistics x
        WHERE es.execution_id = x.execution_id
            AND x.execution_path LIKE es.execution_path + '\%'
        )
ORDER BY es.start_time;
The result of this is a summary of components in the package and performance indicators for them:
- Run duration and % of the total package duration
- Visual indicator for relative duration in the package
- Summary of any warnings flagged by the component
- Number of rows written (for data flows)
This helps us to identify the slowest portions of the package, highlight warnings to be reviewed, and see throughput of records relative to runtime which can highlight bottlenecks.
Here are a couple of real world examples with component details removed:

In this example there’s not a whole lot wrong on the surface. We’ve got a relatively simple package which has one data flow doing the vast majority of the work. The two elements which I’d note are the warning, and the relatively small number of records for the runtime (25/s). There might be a bottleneck worth investigating.
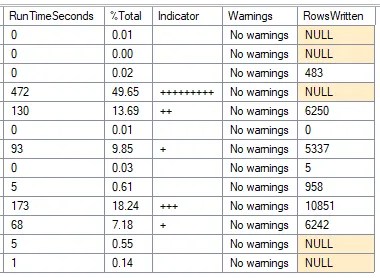
Here we can see a slightly larger package which has multiple data flows. The larger data flows are faster than above (50/s) but still relatively slow and are worth reviewing. The largest batch of work is a stored procedure which is taking half the execution time. Whilst not fixable in the package, there’s still tuning which could be done to help.
Hopefully those give you a flavour of what to expect and how the results can be analysed.
One final reminder that these results are based on Basic logging details, so there’s no understanding of subcomponents within data flows. For those you’d need to use the ‘Performance’ logging level and Execution Performance report.
This script provides a quick way to spot bottlenecks and is a solid starting point for where to focus efforts for improvement. Next time we’ll get into the details of how you can resolve some of the issues uncovered with this report.

3 replies on “Identifying Bottlenecks in SSIS Packages”
[…] Andy Brownsword looks for slow performers: […]
[…] time out we started to look at optimising SSIS packages by showing how to identify bottlenecks with a handy script. This time we’re turning insights into action to solve those pain […]
[…] background in SSIS featured heavily – from identifying bottlenecks, knowing where to look for solutions, to solving blocking, and optimisations including buffer […]