
The question for today: if we have three queries – one which takes 1 second to run, one which takes 2 seconds to run, and one which takes 3 seconds to run – how long will it take to return data for the first and last query if they all start at the same time?
The constraint here is that we have a SQL Server with only a single core CPU, but which has sufficient memory for any data we need to hold and we have read queries which need to be ran.
What I’m looking to demonstrate is how how SQL Server schedules the usage of it’s CPU when we have multiple queries which want to execute at the same time. We’re so used to having multi-core CPUs which can stand up to most demands, but what with SQL Server do when under pressure?
Sample query
For this we want to have a query which will solely focus on the CPU, we don’t want to be dealing with a large volume of data on disk or requiring and competing for memory.
To achieve that we’ll perform a simple calculation over a large set of data. We’ll generate this from records in sys.objects with multiple cross joins to increase the volume. By doing this we’ll have a small footprint from our table, and the aggregate will stream the data through so we won’t need to maintain a large memory grant throughout.
This is being ran in a fresh database on SQL Server 2019 so our sys.objects table only contains 97 records. By performing a CROSS JOIN to 3 other instances we’ll have 97^4 records to aggregate – around 88.5mil records.
Here’s the query we end up with:
SELECT
	SUM(CAST(o1.object_id AS BIGINT)
		+ CAST(o2.object_id AS BIGINT)
		+ CAST(o3.object_id AS BIGINT)
		+ CAST(o4.object_id AS BIGINT))
FROM
	sys.objects o1
	CROSS JOIN sys.objects o2
	CROSS JOIN sys.objects o3
	CROSS JOIN sys.objects o4;
Single execution benchmark
Before we get into benchmarking we need to remember our requirement to use a single CPU core to see how the execution is scheduled. We can set that with the following script (CPU 0 is the first core):
ALTER SERVER CONFIGURATION
SET PROCESS AFFINITY CPU = 0;
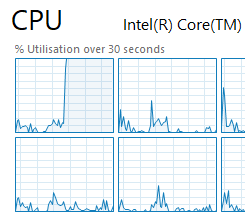
Alternatively, we can set that within Management Studio on the properties for the server node in Object Explorer:

Once that’s set if we were to try and run our query we’ll see our first CPU core is taking the full weight of it:
Right so let’s get to the benchmarking. We’ll turn on the actual execution plan for this and run our query above to see how it looks:
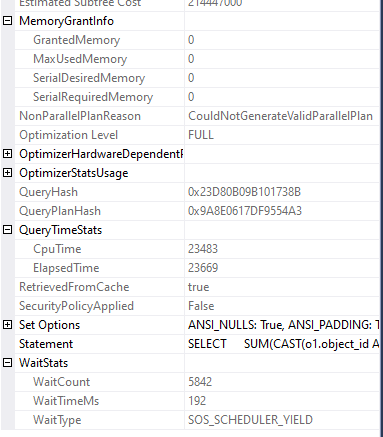
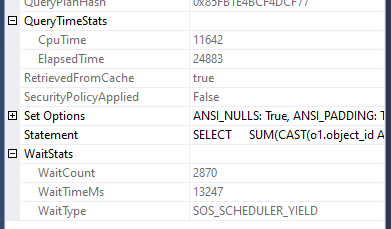
We can see there was no memory granted for the query as we’d hoped. The wait stats show that we were only waiting for CPU and it was for less than 0.2 seconds, only a fractional amount of time that we were running. Finally the overall CPU time on my environment was around 23 seconds – that’s our starting point.
Multiple execution results
For this test I’m using 3 tabs in Management Studio, each loaded with the same script that we had above, and with all of them presenting the actual execution details afterwards.
So, we’re off to the races:

We had 3 queries which would need to be ran for around 23 seconds so we’d expect a runtime of roughly 69 seconds by the time the last one finished.
…and the last one did finish, in a time of 1m 11s!
But it wasn’t just the last one, all 3 of the queries finished at the same time.
This is a key observation: SQL Server won’t run our queries in the order they’re presented, they’ll be round-robin’d on the CPU so they all have an equal chance to process so long as they’re not waiting for anything else. This is known as ‘yielding’ as you’ll see in the wait type.
Let’s have a look how the stats look for one of the executions:
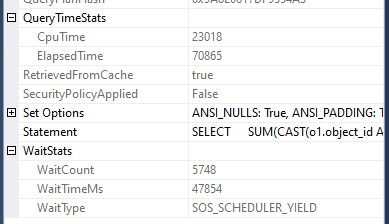
We’ve got 23s of time on the CPU as before, but we can see that we’ve now been waiting for nearly 48s for the CPU to be available. This is the time the other two queries have been running on the CPU instead of this instance of the query.
Different sized workloads
We’ve seen running the same query that they run at the same time and each will take their turn on the CPU. So what is the impact of that in our example when we have workloads of different sizes?
Let’s reduce our example above down to two queries, but we’ll modify one of the queries to only churn half the amount of data. This would therefore take around 12 seconds to complete, coupled with our previous query it would total circa 35 seconds:
SELECT
	SUM(CAST(o1.object_id AS BIGINT)
		+ CAST(o2.object_id AS BIGINT)
		+ CAST(o3.object_id AS BIGINT)
		+ CAST(o4.object_id AS BIGINT))
FROM
	sys.objects o1
	CROSS JOIN sys.objects o2
	CROSS JOIN sys.objects o3
	CROSS JOIN sys.objects o4
WHERE
	/* Removes half of data */
	o4.object_id < 69;
When we run these together what do the results look like?
Our original query runs in the same 23 seconds:
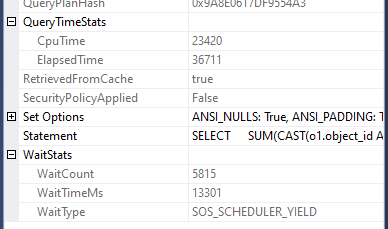
…and our new query is complete in 12 seconds:
We can see that both queries had around the same time waiting for CPU as each other as for the first ~25 seconds they were running together and once the new (smaller) query finished, the original query had full access to complete execution without any further waiting.
I’ve tried to illustrate the way in which the queries will each take turn with processing in the diagram below. Each coloured segment indicates time for that query using the CPU. As you can tell I have absolutely zero artistic qualifications:
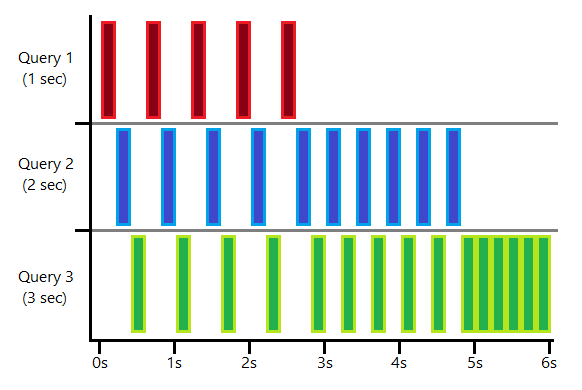
This shows how having more queries executing simultaneously means that each of them gets less time to execute and more time waiting. As each of the shorter queries complete the others will have more time executing relative to the time they’re waiting.
In this example I’ve indicated each slice is around 0.2s however in reality each query will only execute for 4ms on the CPU before switching to another query (more on that for another day).
Wrap up
Let’s come back to our original question:
If we have three queries – one which takes 1 second to run, one which takes 2 seconds to run, and one which takes 3 seconds to run – how long will it take to return data for the first and last query if they all start at the same time?
Andy, at the top of the page
As we now know, all 3 of the queries will execute at the same time. Therefore over the first 3 seconds of execution all of the queries would complete 1 second of work which would complete query one. It would then take a further 2 seconds for queries two and three to complete another second worth of processing, which would complete query two. After that we’d need 1 more second to complete query three.
The result would therefore be that the first query would return after 3 seconds and the final one would return after 6 seconds. The total elapsed time for the queries would be 14 seconds (3s + 5s + 6s) with a total of 8 seconds waiting.
In this example, if the 3 second query was tuned to run in only 1 second it would mean that it could have completed 3 seconds sooner, and not only that but the 2 second query would have returned a second sooner too. In addition to that, by shaving those 2 seconds off our execution time we’d have saved 4 seconds of runtime – 2 seconds from the CPU, and 2 further seconds of waiting.
This demonstrates the criticality of performance tuning on larger environments with high throughput. As we mentioned in the introduction, we’re very much used to having plenty of horsepower available to keep up with whatever workload we need, but it’s when resource gets constrained that it can have a domino effect in terms of performance.

2 replies on “Demonstrating Concurrency in SQL Server”
[…] we looked at single threaded concurrency in SQL Server for workloads which only need a single core to execute. We saw how they ran at […]
[…] recently looked at how single threaded concurrency was handled in SQL Server and followed up last time by diving into multithreaded […]